Groups
Typearray
A group comprises datasets and various processing stages that are inherently interconnected. Group identity is defined by its first process (processId=0), which is usually the raw hardware acquisition process or a processing step that fundamentally changes the nature of the data found in another group (e.g. FMC → TFM). A dataset invariably originates from a process.
The groups array describes a group comprising datasets and/or processes.
| Property | Type | Description |
|---|---|---|
id required |
integer | The unique group id in the JSON structure |
| name | string | The group name |
| usage | string | Additional information concerning the use of the group (e.g. CouplingCheck) |
| datasets | array | One or several datasets among datasets |
| processes | array | One or several processes among processes |
Examples of typical groups structures
The following examples illustrate the typical structure and relationships of groups used in inspections. Note that processes are shown in a chain; however, they could also be branched for more complex cases. Only cross-referenced IDs are represented to help clarify the various intra- and inter-group relationships between processes and datasets.
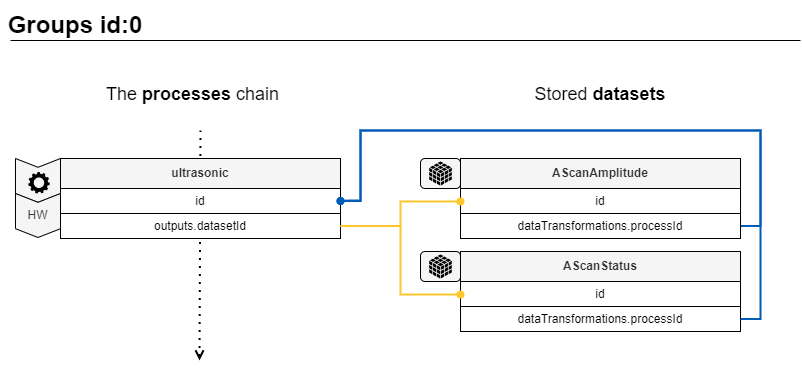
Conventional ultrasonic testing (UT)
This shows a conventional ultrasonic acquisition. Note that the AScanStatus dataset is optional.
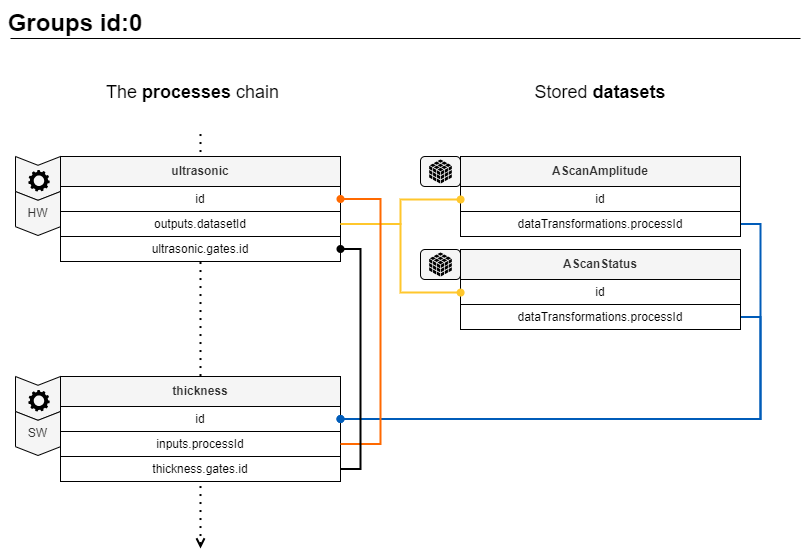
This shows a conventional ultrasonic acquisition with thickness measurement on a gate. Note that the AScanStatus dataset is optional.
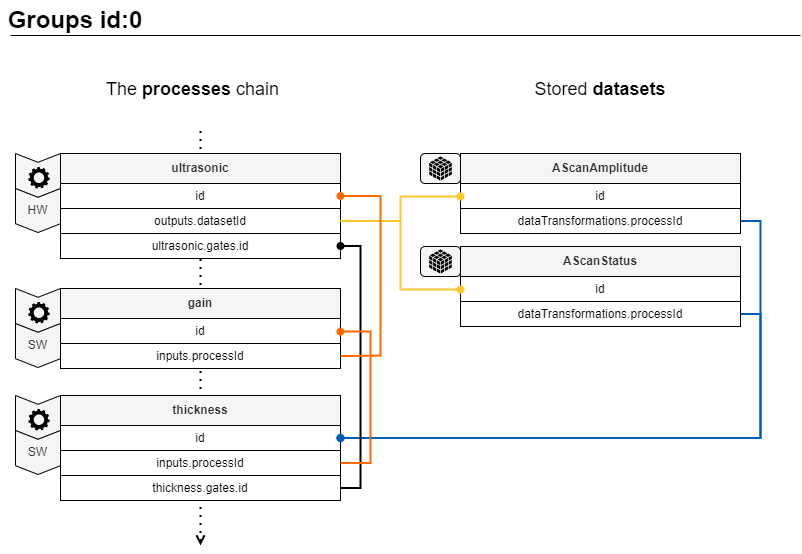
This shows a conventional ultrasonic acquisition with thickness measurement on a gate and a gain. Note that the AScanStatus dataset is optional.
Phased array ultrasonic testing (PAUT)
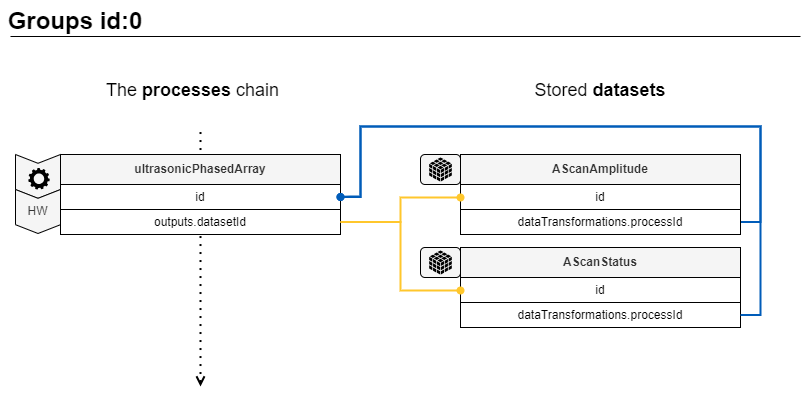
This shows a phased array ultrasonic acquisition. Note that the AScanStatus dataset is optional.
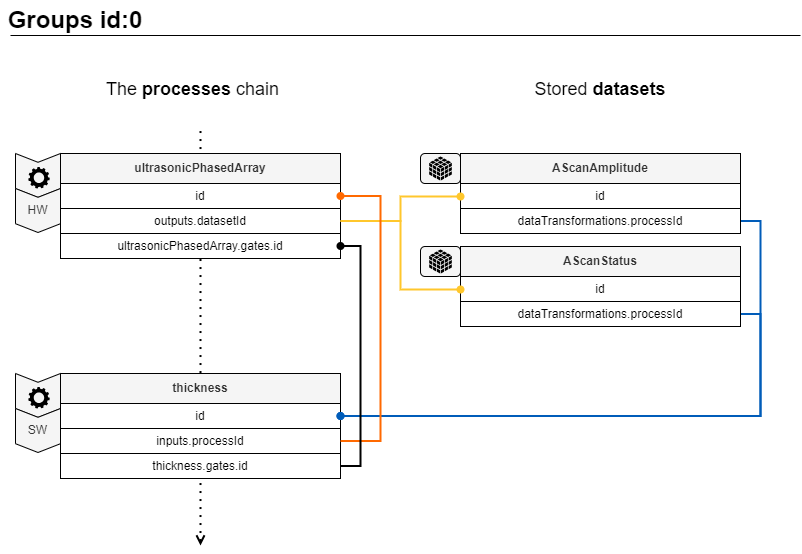
This shows a phased array ultrasonic acquisition with thickness measurement on a gate. Note that the AScanStatus dataset is optional.
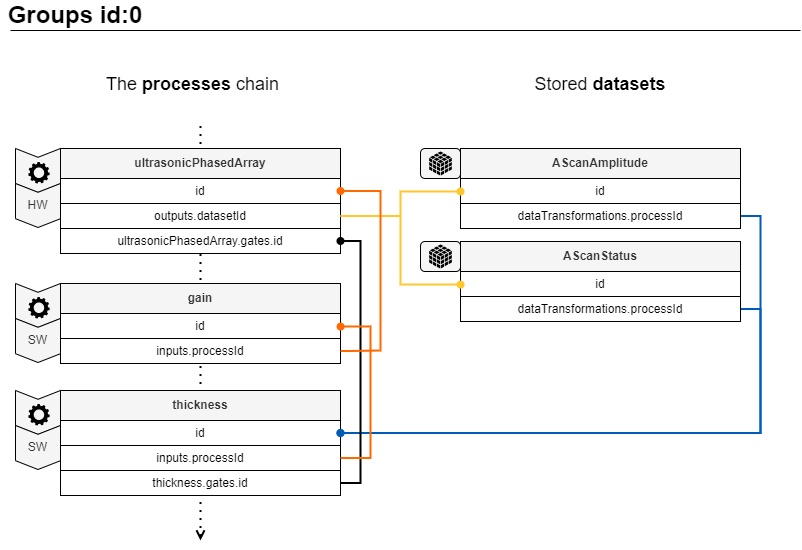
This shows a phased array ultrasonic acquisition with thickness measurement on a gate and a gain. Note that the AScanStatus dataset is optional.
Total focusing method (TFM)
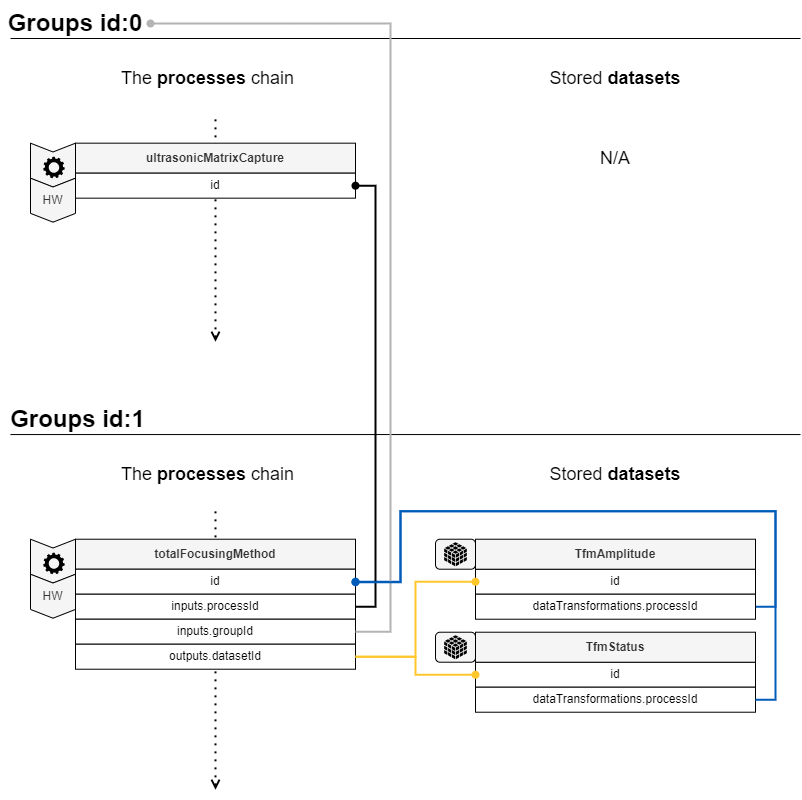
This shows a TFM reconstruction by collection of a FMC. Note that the TfmStatus dataset is optional.
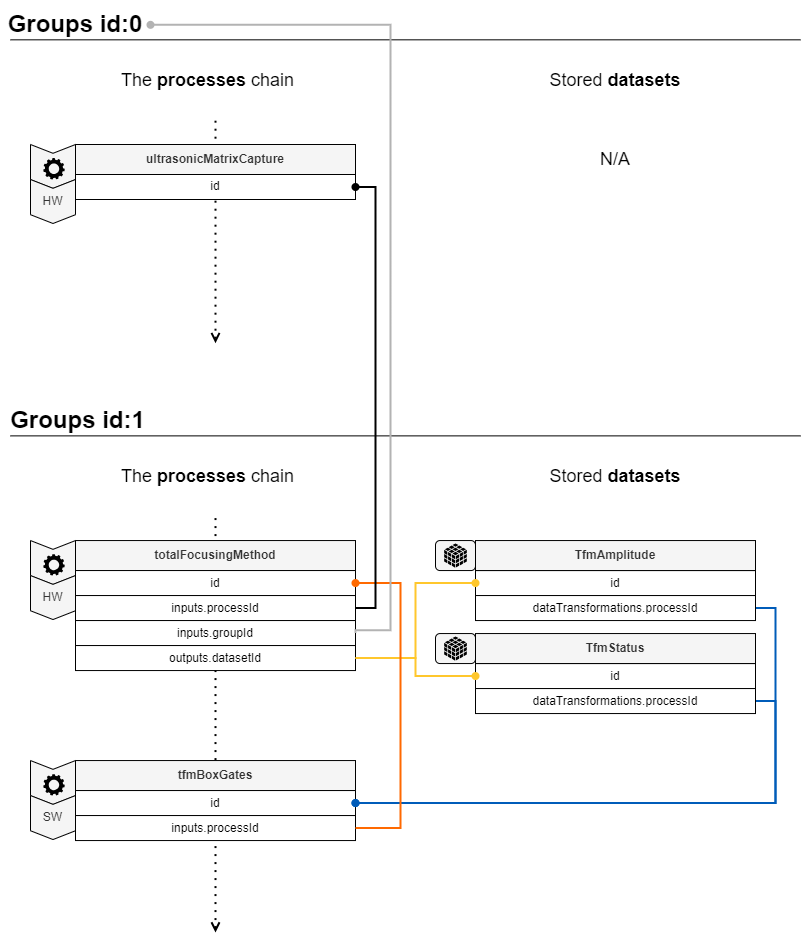
This shows a TFM reconstruction of an FMC acquisition with gates defined on the TFM image. Note that the TfmStatus dataset is optional.
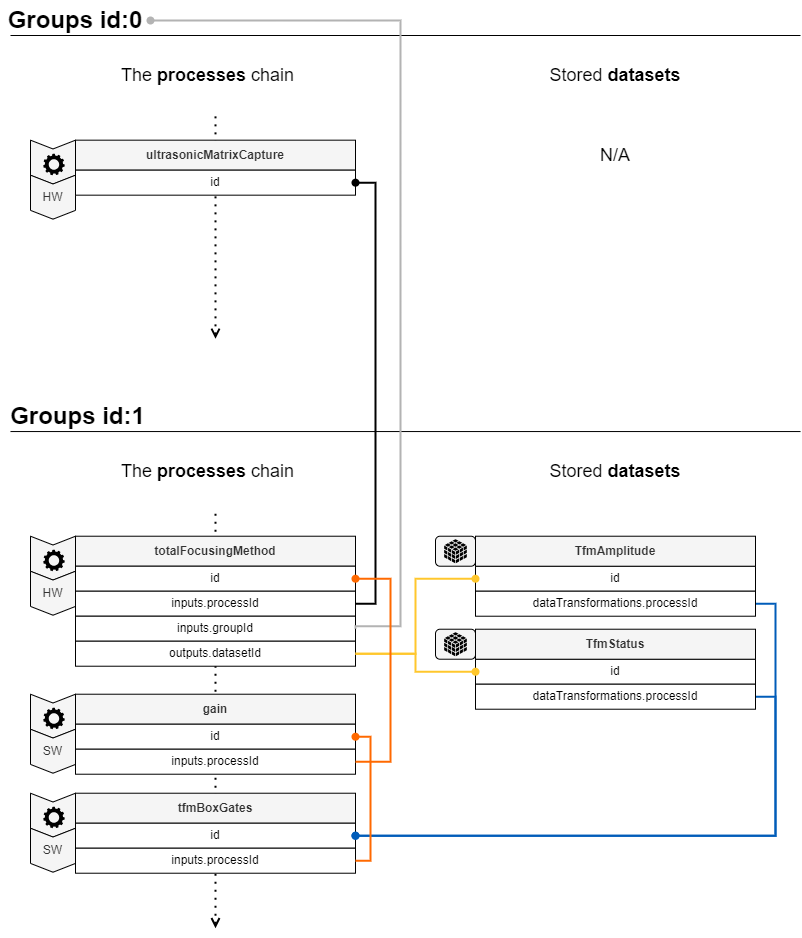
This shows a TFM reconstruction of an FMC acquisition with gates on the TFM image and a gain. Note that the TfmStatus dataset is optional.
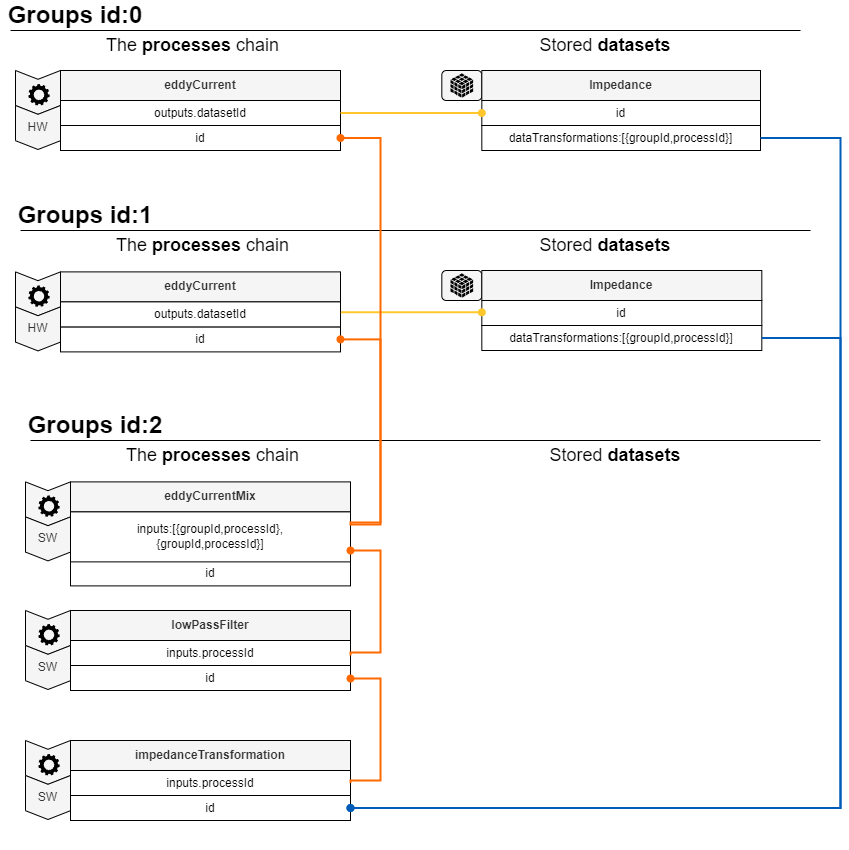
Conventional eddy current testing (ECT)
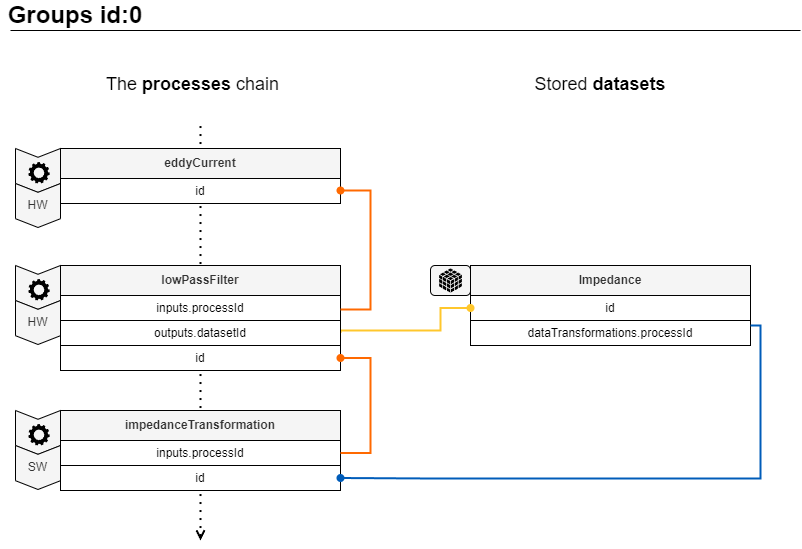
This shows a conventional eddy current acquisition with hardware low pass filtering and software impedance transformation.
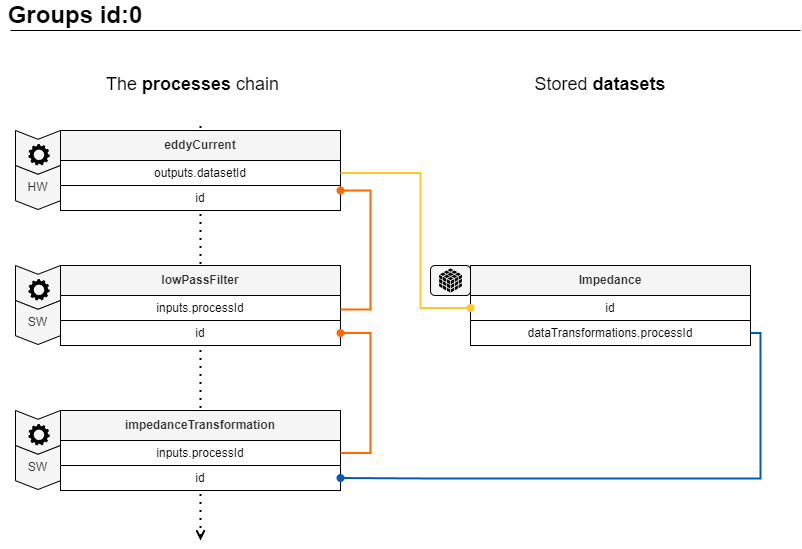
This shows a conventional eddy current acquisition with software low pass filtering and software impedance transformation.
This shows a conventional eddy current acquisition with software eddy current mix process followed by low pass filtering and impedance transformation.